Slicer Core

Steve Pieper
Steve Pieper, PhD
Core PI


Our Publications

The role of the Slicer Core, is to facilitate the practical translation of NAC technologies to a user accessible platform in support of internal NAC research, clinical application, and broader dissemination. These goals are accomplished through software innovation and the creation and maintenance of software for 3D Slicer (a.k.a. Slicer), a package which has grown over the last 10 years from a graduate student project within NAC to a leading tool in the image analysis field. Slicer has a strong network of contributing authors supported by a number of funding mechanisms including the National Alliance for Medical Image Computing (NA-MIC) and the National Center for Image Guided Therapy (NCIGT). NCIGT also provides the driving biomedical project (DBP) for this core. Each of our partners brings a unique set of driving projects and investigators that strengthen the underlying Slicer platform. The NCI Quantitative Imaging Network (QIN) and the Ontario SparKit efforts, both of which are service collaborations of NAC, provide additional motivating use cases and development synergy. Within the NAC research community, creation of Slicer-compatible code is a recognized sign that ideas have matured from initial concept to a form suitable for users to test with their own data. Clinical domain experts are the key group of users for Slicer. They provide both the problem definitions and the working context in which new ideas and approaches can be evaluated and improved. These efforts result in code modules in Slicer that form the basis for outreach efforts. In this way, the research community can benefit from both the original published method and the embodiment of the concept within a working tool. The work of this core is organized around the following specific aims.

  1. Refine Slicer as a research platform for creation and dissemination of NAC technologies.
  2. Adapt Slicer to rapidly integrate, analyze, and visualize multimodal data.
  3. Define and apply Slicer CaseHub tools to neurosurgery in AMIGO.

In addition to providing leadership and participation in the 3D Slicer community and other national and international efforts (aim 1), the core is creating a new set of user-steered tools to permit rapid analysis and visualization of multimodal data driven by the needs of its DBP (aim 2), as well as a new “CaseHub” framework to manage sequentially acquired scans and other data from ongoing clinical scenarios. The idea is to enable clinical experts to review and understand the evolving patient state and determine next treatment steps in a dynamic and time constrained environment, where critical decisions must be made within a 10-15 minute window of time (aim 3). The target of this work is the NCIGT's Advanced Multimodality Image Guided Operating (AMIGO) Suite. AMIGO is the clinical translational testbed of NCIGT. In AMIGO, real-time anatomical imaging modalities, such as X-ray and ultrasound, can be combined with cross-sectional digital imaging systems including CT, MRI, and PET. Molecular image-guided therapies are investigated with multiple molecular probes, such as PET, optical imaging, and targeted mass spectrometry, to increase the sensitivity and specificity of cancer detection. The application of these tools and data management framework is expected to improve the definition of tumor margins to enable more complete excision and/or thermal ablation. As illustrated in the three Featured Technologies below, the improved Slicer user-steered tools and CaseHub server technology have continued to evolve and have taken the form of (1) advanced Slicer-based image analysis tools, (2) custom software for MR and ultrasound data integration in neurosurgery, and (3) evaluations of web applications as a platform for NAC research.

Featured Technologies

3D Slicer Platform

Figure 1 shows just some of the many projects building on the 3D Slicer platform and the bullets below include links and short descriptions of some of the notable developments of the past year involving and building on NAC technology.

  • Segmentations / Segment Editor - powerful new infrastructure to represent and operate on image segmentations including natively 3D interactions.
  • Quantitative Imaging / DICOM - greatly improved standards-based data representation, validated in the context of connectathons at RSNA
  • SlicerRadiomics - researcher-friendly tools for image feature calculation.
  • SlicerDMRI - world-class diffusion analysis and tractography tools.
  • SlicerCIP - chest imaging platform to quantify airways and related structures.
  • SlicerHeart - new 4D ultrasound processing and cardiac analysis tools.
  • SlicerSALT - a comprehensive medical image shape analysis package.
  • SlicerCMF - custom tools and distribution for dental and craniomaxillofacial surgery.
  • SlicerRT - extensive infrastructure for radiotherapy research.
  • SlicerIGT - custom modules to build fully functional image guided surgery prototypes.
  • SlicerPathology - mixing 3D Slicer with cloud databases for terascale microscopy analysis.

Full documentation of the 3D Slicer ecosystem is always available at http://slicer.org.
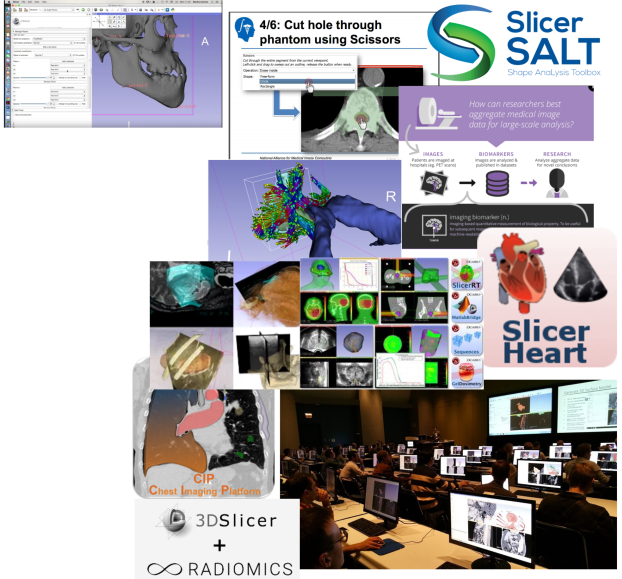
Slicer Activities

Figure 1. A sampling of 3D Slicer activities.

Slicer-based Image Analysis

Hierarchical Segmentation of Brain Pathology Images

Extracting nuclei is one of the most actively studied topics in digital pathology research. It is essential in surgical planning and may be combined with mass spectrometry data during surgical procedures. Most of the studies directly search the nuclei (or seeds for the nuclei) from the finest resolution available. While the richest information has been utilized by such approaches, it is sometimes difficult to address the heterogeneity of nuclei in different tissues. In our recent work, we propose a hierarchical approach, which starts from the lower resolution level and adaptively adjusts the parameters while progressing into finer and finer resolution. This approach employs the Fast GrowCut algorithm as a key part of the pipeline. Fast GrowCut was developed as part of our NAC-sponsored research. This work is embodied in our SlicerPathology extension as illustrated in Figure 2 and can be seen in a video demonstration online.
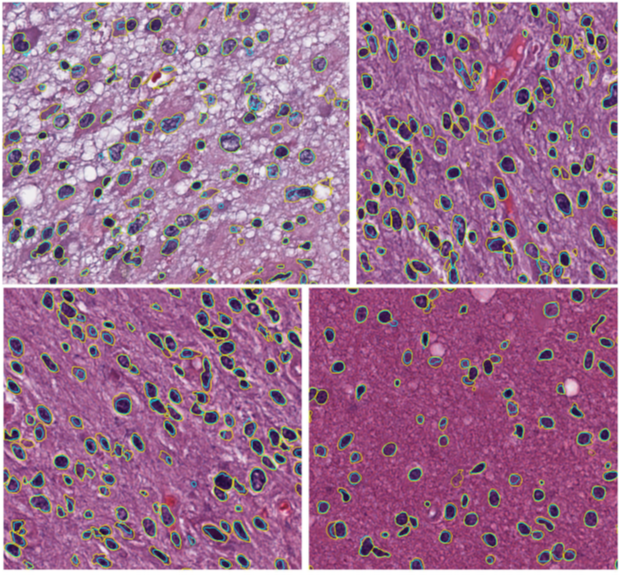
SlicerPathology

Figure 2. Four example brain Images: Yellow manual; cyan algorithmic. Taken from 15 TCGA brain images about 700 by 700 with resolution 0.25 µm/pixel.

MR-Ultrasound Fusion for Neurosurgery

NAC has developed the AmigoDataCollection module as a concrete implementation of the CaseHub architecture to integrate multiple modes of intraprocedural image data into a unified data space for visualization and analysis. As shown in the figure, the custom module provides push-button data acquisition options for volumetric ultrasound acquisition, stereo image capture, and recording of the position and orientation of tracked surgical instruments.
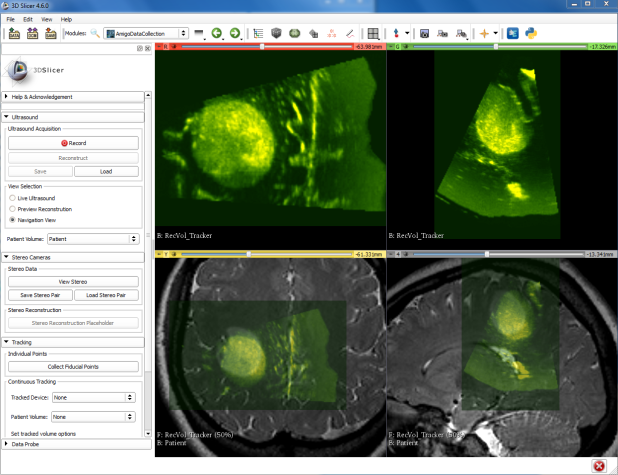
slicer US MR fusion


Within 3D Slicer this data can be interactively reviewed, as demonstrated in this video showing two timepoints of intraprocedural ultrasounds superimposed on pre-procedure MR images.

Web Applications for Neuroimage Analysis

NAC continues to innovate in the area of software infrastructure technologies for neuroimage analysis, and in the context of intraprocedural imaging we seek easily deployable yet high performance computing environments. To this end, we have looked at the question of GPU accelerated image computing that can run in the latest breed of conventional web browsers. Specifically we investigated the use of WebGL2 technology, which is now standard in Google Chrome and Mozilla Firefox browsers, as a platform for image processing operations.  WebGL2 is a Khronos industry standard set of JavaScript bindings to the OpenGLES 3.0 functionality that is ubiquitous in electronic devices from smart TVs through mobile phones and desktop computers and advanced workstations.  The same WebGL2 code that runs on the Chrome browser on an Android smartphone can also leverage the computing power of the latest generation of workstation graphics cards, thus supporting a wide range of use scenarios with a single code base.  To evaluate the functionality we implemented and tested two important pieces of functionality as demonstrated in the video linked here: (1) we load and correctly display MR neuroimaging data in native DICOM format, and (2) we apply compute intensive 3D nonlinear image filtering at interactive rates.  The image filter in question, the bilateral filter, is implemented as a multithreaded filter in ITK and consumes the full compute resources of an 8 core Xeon E5-2620 @2.1 GHz for over 8 minutes.  In contrast, the same calculation is performed in approximately 2 seconds on an Nvidia GTX 1080 graphics card when implemented in GLSL shader code on WebGL2, a performance improvement of over 200x. Based on these results we are continuing to develop our WebGL2 based computing framework.

Publications

  • Neumann PE, Halle MW, Kong J, Kikinis R. West Meets East: Taking a Stab at Acupuncture Point Names. Clin Anat. 2023;35:641–50.

    Acupuncture point names written in Chinese Han characters often provide clinically useful information in both their literal and figurative meanings about location and therapeutic use. The World Health Organization (WHO) standard acupuncture nomenclature includes these names in Han characters in an unusual array that includes both "original" forms and, in parentheses, simplified forms. Construction of a multilingual table of acupuncture point names during development of a database revealed that the assumption that the "original" form in the WHO nomenclature was the traditional Chinese character was frequently false. The Han character forms in the pdf of the 2009 reprint of WHO Standard Acupuncture Point Locations were carefully compared with Han characters used in traditional and simplified Chinese, Japanese and Korean writing systems. This work utilized three online tools: UnicodePlus, Unihan Database Lookup, and Wiktionary. Only 48% of the "original" character forms were traditional Chinese characters. The Unicode number was correct in 99%, but in most cases the East Asian font used was not a traditional Chinese one. The issue about Han character forms was also found in all earlier versions of the WHO standard acupuncture nomenclature. Other detected problems included the use of wrong characters for an "original" character form in one name and for a simplified character form in another name. The WHO standard acupuncture nomenclature should be revised with a focus on accuracy in the usage of Han characters.

  • Zheng J, Yang Q, Makris N, Huang K, Liang J, Ye C, Yu X, Tian M, Ma T, Mou T, Guo W, Kikinis R, Gao Y. Three-Dimensional Digital Reconstruction of the Cerebellar Cortex: Lobule Thickness, Surface Area Measurements, and Layer Architecture. Cerebellum. 2023;22(2):249–60.

    The cerebellum is ontogenetically one of the first structures to develop in the central nervous system; nevertheless, it has been only recently reconsidered for its significant neurobiological, functional, and clinical relevance in humans. Thus, it has been a relatively under-studied compared to the cerebrum. Currently, non-invasive imaging modalities can barely reach the necessary resolution to unfold its entire, convoluted surface, while only histological analyses can reveal local information at the micrometer scale. Herein, we used the BigBrain dataset to generate area and point-wise thickness measurements for all layers of the cerebellar cortex and for each lobule in particular. We found that the overall surface area of the cerebellar granular layer (including Purkinje cells) was 1,732 cm2 and the molecular layer was 1,945 cm2. The average thickness of the granular layer is 0.88 mm (± 0.83) and that of the molecular layer is 0.32 mm (± 0.08). The cerebellum (both granular and molecular layers) is thicker at the depth of the sulci and thinner at the crowns of the gyri. Globally, the granular layer is thicker in the lateral-posterior-inferior region than the medial-superior regions. The characterization of individual layers in the cerebellum achieved herein represents a stepping-stone for investigations interrelating structural and functional connectivity with cerebellar architectonics using neuroimaging, which is a matter of considerable relevance in basic and clinical neuroscience. Furthermore, these data provide templates for the construction of cerebellar topographic maps and the precise localization of structural and functional alterations in diseases affecting the cerebellum.

  • Sastry R, Bi WL, Pieper S, Frisken S, Kapur T, Wells WM III, Golby AJ. Applications of Ultrasound in the Resection of Brain Tumors. J Neuroimaging. 2017;27(1):5–15.

    Neurosurgery makes use of preoperative imaging to visualize pathology, inform surgical planning, and evaluate the safety of selected approaches. The utility of preoperative imaging for neuronavigation, however, is diminished by the well-characterized phenomenon of brain shift, in which the brain deforms intraoperatively as a result of craniotomy, swelling, gravity, tumor resection, cerebrospinal fluid (CSF) drainage, and many other factors. As such, there is a need for updated intraoperative information that accurately reflects intraoperative conditions. Since 1982, intraoperative ultrasound has allowed neurosurgeons to craft and update operative plans without ionizing radiation exposure or major workflow interruption. Continued evolution of ultrasound technology since its introduction has resulted in superior imaging quality, smaller probes, and more seamless integration with neuronavigation systems. Furthermore, the introduction of related imaging modalities, such as 3-dimensional ultrasound, contrast-enhanced ultrasound, high-frequency ultrasound, and ultrasound elastography, has dramatically expanded the options available to the neurosurgeon intraoperatively. In the context of these advances, we review the current state, potential, and challenges of intraoperative ultrasound for brain tumor resection. We begin by evaluating these ultrasound technologies and their relative advantages and disadvantages. We then review three specific applications of these ultrasound technologies to brain tumor resection: (1) intraoperative navigation, (2) assessment of extent of resection, and (3) brain shift monitoring and compensation. We conclude by identifying opportunities for future directions in the development of ultrasound technologies.

  • Chen X, Xu L, Wang H, Wang F, Wang Q, Kikinis R. Development of a Surgical Navigation System Based on 3D Slicer for Intraoperative Implant Placement Surgery. Med Eng Phys. 2017;41:81–9.

    Implant placement has been widely used in various kinds of surgery. However, accurate intraoperative drilling performance is essential to avoid injury to adjacent structures. Although some commercially-available surgical navigation systems have been approved for clinical applications, these systems are expensive and the source code is not available to researchers. 3D Slicer is a free, open source software platform for the research community of computer-aided surgery. In this study, a loadable module based on Slicer has been developed and validated to support surgical navigation. This research module allows reliable calibration of the surgical drill, point-based registration and surface matching registration, so that the position and orientation of the surgical drill can be tracked and displayed on the computer screen in real time, aiming at reducing risks. In accuracy verification experiments, the mean target registration error (TRE) for point-based and surface-based registration were 0.31±0.06mm and 1.01±0.06mm respectively, which should meet clinical requirements. Both phantom and cadaver experiments demonstrated the feasibility of our surgical navigation software module.

  • Bernal-Rusiel JL, Rannou N, Gollub RL, Pieper S, Murphy S, Robertson R, Grant PE, Pienaar R. Reusable Client-Side JavaScript Modules for Immersive Web-Based Real-Time Collaborative Neuroimage Visualization. Front Neuroinform. 2017;11:32.

    In this paper we present a web-based software solution to the problem of implementing real-time collaborative neuroimage visualization. In both clinical and research settings, simple and powerful access to imaging technologies across multiple devices is becoming increasingly useful. Prior technical solutions have used a server-side rendering and push-to-client model wherein only the server has the full image dataset. We propose a rich client solution in which each client has all the data and uses the Google Drive Realtime API for state synchronization. We have developed a small set of reusable client-side object-oriented JavaScript modules that make use of the XTK toolkit, a popular open-source JavaScript library also developed by our team, for the in-browser rendering and visualization of brain image volumes. Efficient realtime communication among the remote instances is achieved by using just a small JSON object, comprising a representation of the XTK image renderers’ state, as the Google Drive Realtime collaborative data model. The developed open-source JavaScript modules have already been instantiated in a web-app called MedView, a distributed collaborative neuroimage visualization application that is delivered to the users over the web without requiring the installation of any extra software or browser plugin. This responsive application allows multiple physically distant physicians or researchers to cooperate in real time to reach a diagnosis or scientific conclusion. It also serves as a proof of concept for the capabilities of the presented technological solution.

  • Ou Y, Zöllei L, Retzepi K, Castro V, Bates S V, Pieper S, Andriole KP, Murphy SN, Gollub RL, Grant PE. Using Clinically Acquired MRI to Construct Age-specific Atlases: Quantifying Spatiotemporal ADC Changes from Birth to 6-year Old. Hum Brain Mapp. 2017;38(6):3052–68.

    Diffusion imaging is critical for detecting acute brain injury. However, normal apparent diffusion coefficient (ADC) maps change rapidly in early childhood, making abnormality detection difficult. In this article, we explored clinical PACS and electronic healthcare records (EHR) to create age-specific ADC atlases for clinical radiology reference. Using the EHR and three rounds of multiexpert reviews, we found ADC maps from 201 children 0-6 years of age scanned between 2006 and 2013 who had brain MRIs with no reported abnormalities and normal clinical evaluations 2+ years later. These images were grouped in 10 age bins, densely sampling the first 1 year of life (5 bins, including neonates and 4 quarters) and representing the 1-6 year age range (an age bin per year). Unbiased group-wise registration was used to construct ADC atlases for 10 age bins. We used the atlases to quantify (a) cross-sectional normative ADC variations; (b) spatiotemporal heterogeneous ADC changes; and (c) spatiotemporal heterogeneous volumetric changes. The quantified age-specific whole-brain and region-wise ADC values were compared to those from age-matched individual subjects in our study and in multiple existing independent studies. The significance of this study is that we have shown that clinically acquired images can be used to construct normative age-specific atlases. These first of their kind age-specific normative ADC atlases quantitatively characterize changes of myelination-related water diffusion in the first 6 years of life. The quantified voxel-wise spatiotemporal ADC variations provide standard references to assist radiologists toward more objective interpretation of abnormalities in clinical images. Our atlases are available at https://www.nitrc.org/projects/mgh_adcatlases.

  • Kikinis Z, Muehlmann M, Pasternak O, Peled S, Kulkarni P, Ferris C, Bouix S, Rathi Y, Koerte IK, Pieper S, Yarmarkovich A, Porter CL, Kristal BS, Shenton ME. Diffusion Imaging of Mild Traumatic Brain Injury in the Impact Accelerated Rodent Model: A Pilot Study. Brain Inj. 2017;31(10):1376–81.

    PRIMARY OBJECTIVE: There is a need to understand pathologic processes of the brain following mild traumatic brain injury (mTBI). Previous studies report axonal injury and oedema in the first week after injury in a rodent model. This study aims to investigate the processes occurring 1 week after injury at the time of regeneration and degeneration using diffusion tensor imaging (DTI) in the impact acceleration rat mTBI model. RESEARCH DESIGN: Eighteen rats were subjected to impact acceleration injury, and three rats served as sham controls. Seven days post injury, DTI was acquired from fixed rat brains using a 7T scanner. Group comparison of Fractional Anisotropy (FA) values between traumatized and sham animals was performed using Tract-Based Spatial Statistics (TBSS), a method that we adapted for rats. MAIN OUTCOMES AND RESULTS: TBSS revealed white matter regions of the brain with increased FA values in the traumatized versus sham rats, localized mainly to the contrecoup region. Regions of increased FA included the pyramidal tract, the cerebral peduncle, the superior cerebellar peduncle and to a lesser extent the fibre tracts of the corpus callosum, the anterior commissure, the fimbria of the hippocampus, the fornix, the medial forebrain bundle and the optic chiasm. CONCLUSION: Seven days post injury, during the period of tissue reparation in the impact acceleration rat model of mTBI, microstructural changes to white matter can be detected using DTI.

  • Yip SSF, Parmar C, Blezek D, Estepar RSJ, Pieper S, Kim J, Aerts HJWL. Application of the 3D Slicer Chest Imaging Platform Segmentation Algorithm for Large Lung Nodule Delineation. PLoS One. 2017;12(6):e0178944.

    PURPOSE: Accurate segmentation of lung nodules is crucial in the development of imaging biomarkers for predicting malignancy of the nodules. Manual segmentation is time consuming and affected by inter-observer variability. We evaluated the robustness and accuracy of a publically available semiautomatic segmentation algorithm that is implemented in the 3D Slicer Chest Imaging Platform (CIP) and compared it with the performance of manual segmentation. METHODS: CT images of 354 manually segmented nodules were downloaded from the LIDC database. Four radiologists performed the manual segmentation and assessed various nodule characteristics. The semiautomatic CIP segmentation was initialized using the centroid of the manual segmentations, thereby generating four contours for each nodule. The robustness of both segmentation methods was assessed using the region of uncertainty (δ) and Dice similarity index (DSI). The robustness of the segmentation methods was compared using the Wilcoxon-signed rank test (pWilcoxon<0.05). The Dice similarity index (DSIAgree) between the manual and CIP segmentations was computed to estimate the accuracy of the semiautomatic contours. RESULTS: The median computational time of the CIP segmentation was 10 s. The median CIP and manually segmented volumes were 477 ml and 309 ml, respectively. CIP segmentations were significantly more robust than manual segmentations (median δCIP = 14ml, median dsiCIP = 99% vs. median δmanual = 222ml, median dsimanual = 82%) with pWilcoxon 10-16. The agreement between CIP and manual segmentations had a median DSIAgree of 60%. While 13% (47/354) of the nodules did not require any manual adjustment, minor to substantial manual adjustments were needed for 87% (305/354) of the nodules. CIP segmentations were observed to perform poorly (median DSIAgree≈50%) for non-/sub-solid nodules with subtle appearances and poorly defined boundaries. CONCLUSION: Semi-automatic CIP segmentation can potentially reduce the physician workload for 13% of nodules owing to its computational efficiency and superior stability compared to manual segmentation. Although manual adjustment is needed for many cases, CIP segmentation provides a preliminary contour for physicians as a starting point.

  • Herz C, Fillion-Robin JC, Onken M, Riesmeier J, Lasso A, Pinter C, Fichtinger G, Pieper S, Clunie D, Kikinis R, Fedorov A. DCMQI: An Open Source Library for Standardized Communication of Quantitative Image Analysis Results using DICOM. Cancer Research. 2017;77(21):e87-e90.

    Quantitative analysis of clinical image data is an active area of research that holds promise for precision medicine, early assessment of treatment response, and objective characterization of the disease. Interoperability, data sharing, and the ability to mine the resulting data are of increasing importance, given the explosive growth in the number of quantitative analysis methods being proposed. The Digital Imaging and Communications in Medicine (DICOM) standard is widely adopted for image and metadata in radiology. dcmqi (DICOM for Quantitative Imaging) is a free, open source library that implements conversion of the data stored in commonly used research formats into the standard DICOM representation. dcmqi source code is distributed under BSD-style license. It is freely available as a precompiled binary package for every major operating system, as a Docker image, and as an extension to 3D Slicer. Installation and usage instructions are provided on Harvard DASH.

  • Kapur T, Pieper S, Fedorov A, Fillion-Robin JC, Halle M, Donnell LO, Lasso A, Ungi T, Pinter C, Finet J, Pujol S, Jagadeesan J, Tokuda J, Norton I, Estepar RSJ, Gering D, Aerts HJWL, Jakab M, Hata N, Ibanez L, Blezek D, Miller J, Aylward S, Grimson EL, Fichtinger G, Wells WM III, Lorensen WE, Schroeder W, Kikinis R. Increasing the Impact of Medical Image Computing using Community-based Open-access Hackathons: The NA-MIC and 3D Slicer Experience. Med Image Anal. 2016;33:176–80.

    The National Alliance for Medical Image Computing (NA-MIC) was launched in 2004 with the goal of investigating and developing an open source software infrastructure for the extraction of information and knowledge from medical images using computational methods. Several leading research and engineering groups participated in this effort that was funded by the US National Institutes of Health through a variety of infrastructure grants. This effort transformed 3D Slicer from an internal, Boston-based, academic research software application into a professionally maintained, robust, open source platform with an international leadership and developer and user communities. Critical improvements to the widely used underlying open source libraries and tools-VTK, ITK, CMake, CDash, DCMTK-were an additional consequence of this effort. This project has contributed to close to a thousand peer-reviewed publications and a growing portfolio of US and international funded efforts expanding the use of these tools in new medical computing applications every year. In this editorial, we discuss what we believe are gaps in the way medical image computing is pursued today; how a well-executed research platform can enable discovery, innovation and reproducible science ("Open Science"); and how our quest to build such a software platform has evolved into a productive and rewarding social engineering exercise in building an open-access community with a shared vision.

  • Fedorov A, Clunie D, Ulrich E, Bauer C, Wahle A, Brown B, Onken M, Riesmeier J, Pieper S, Kikinis R, Buatti J, Beichel RR. DICOM for Quantitative Imaging Biomarker Development: A Standards Based Approach to Sharing Clinical Data and Structured PET/CT Analysis Results in Head and Neck Cancer Research. PeerJ. 2016;4:e2057.

    Background. Imaging biomarkers hold tremendous promise for precision medicine clinical applications. Development of such biomarkers relies heavily on image post-processing tools for automated image quantitation. Their deployment in the context of clinical research necessitates interoperability with the clinical systems. Comparison with the established outcomes and evaluation tasks motivate integration of the clinical and imaging data, and the use of standardized approaches to support annotation and sharing of the analysis results and semantics. We developed the methodology and tools to support these tasks in Positron Emission Tomography and Computed Tomography (PET/CT) quantitative imaging (QI) biomarker development applied to head and neck cancer (HNC) treatment response assessment, using the Digital Imaging and Communications in Medicine (DICOM(®)) international standard and free open-source software. Methods. Quantitative analysis of PET/CT imaging data collected on patients undergoing treatment for HNC was conducted. Processing steps included Standardized Uptake Value (SUV) normalization of the images, segmentation of the tumor using manual and semi-automatic approaches, automatic segmentation of the reference regions, and extraction of the volumetric segmentation-based measurements. Suitable components of the DICOM standard were identified to model the various types of data produced by the analysis. A developer toolkit of conversion routines and an Application Programming Interface (API) were contributed and applied to create a standards-based representation of the data. Results. DICOM Real World Value Mapping, Segmentation and Structured Reporting objects were utilized for standards-compliant representation of the PET/CT QI analysis results and relevant clinical data. A number of correction proposals to the standard were developed. The open-source DICOM toolkit (DCMTK) was improved to simplify the task of DICOM encoding by introducing new API abstractions. Conversion and visualization tools utilizing this toolkit were developed. The encoded objects were validated for consistency and interoperability. The resulting dataset was deposited in the QIN-HEADNECK collection of The Cancer Imaging Archive (TCIA). Supporting tools for data analysis and DICOM conversion were made available as free open-source software. Discussion. We presented a detailed investigation of the development and application of the DICOM model, as well as the supporting open-source tools and toolkits, to accommodate representation of the research data in QI biomarker development. We demonstrated that the DICOM standard can be used to represent the types of data relevant in HNC QI biomarker development, and encode their complex relationships. The resulting annotated objects are amenable to data mining applications, and are interoperable with a variety of systems that support the DICOM standard.

  • This tutorial demonstrates how to prepare data for 3D printing using the open source software 3D Slicer. The following topics are highlighted in the tutorial: introduction to the 3D Slicer interface, loading data into 3D Slicer, volume rendering, cropping image volumes, creating label maps, creating surface models, and saving data in file formats appropriate for 3D printing.

  • Lemaire JJ, Golby A, Wells WM III, Pujol S, Tie Y, Rigolo L, Yarmarkovich A, Pieper S, Westin CF, Jolesz FA, Kikinis R. Extended Broca’s Area in the Functional Connectome of Language in Adults: Combined Cortical and Subcortical Single-subject Analysis using fMRI and DTI Tractography. Brain Topogr. 2013;26(3):428–41.

    Traditional models of the human language circuitry encompass three cortical areas, Broca s, Geschwind s and Wernicke s, and their connectivity through white matter fascicles. The neural connectivity deep to these cortical areas remains poorly understood, as does the macroscopic functional organization of the cortico-subcortical language circuitry. In an effort to expand current knowledge, we combined functional MRI (fMRI) and diffusion tensor imaging to explore subject-specific structural and functional macroscopic connectivity, focusing on Broca s area. Fascicles were studied using diffusion tensor imaging fiber tracking seeded from volumes placed manually within the white matter. White matter fascicles and fMRI-derived clusters (antonym-generation task) of positive and negative blood-oxygen-level-dependent (BOLD) signal were co-registered with 3-D renderings of the brain in 12 healthy subjects. Fascicles connecting BOLD-derived clusters were analyzed within specific cortical areas: Broca s, with the pars triangularis, the pars opercularis, and the pars orbitaris; Geschwind s and Wernicke s; the premotor cortex, the dorsal supplementary motor area, the middle temporal gyrus, the dorsal prefrontal cortex and the frontopolar region. We found a functional connectome divisible into three systems-anterior, superior and inferior-around the insula, more complex than previously thought, particularly with respect to a new extended Broca s area. The extended Broca s area involves two new fascicles: the operculo-premotor fascicle comprised of well-organized U-shaped fibers that connect the pars opercularis with the premotor region; and (2) the triangulo-orbitaris system comprised of intermingled U-shaped fibers that connect the pars triangularis with the pars orbitaris. The findings enhance our understanding of language function.

  • Vosburgh KG, Golby A, Pieper SD. Surgery, Virtual Reality, and the Future. Stud Health Technol Inform. 2013;184:7–13.

    MMVR has provided the leading forum for the multidisciplinary interaction and development of the use of Virtual Reality (VR) techniques in medicine, particularly in surgical practice. Here we look back at the foundations of our field, focusing on the use of VR in Surgery and similar interventional procedures, sum up the current status, and describe the challenges and opportunities going forward.

  • Egger J, Kapur T, Fedorov A, Pieper S, Miller J V, Veeraraghavan H, Freisleben B, Golby AJ, Nimsky C, Kikinis R. GBM Volumetry using the 3D Slicer Medical Image Computing Platform. Sci Rep. 2013;3:1364.

    Volumetric change in glioblastoma multiforme (GBM) over time is a critical factor in treatment decisions. Typically, the tumor volume is computed on a slice-by-slice basis using MRI scans obtained at regular intervals. (3D)Slicer - a free platform for biomedical research - provides an alternative to this manual slice-by-slice segmentation process, which is significantly faster and requires less user interaction. In this study, 4 physicians segmented GBMs in 10 patients, once using the competitive region-growing based GrowCut segmentation module of Slicer, and once purely by drawing boundaries completely manually on a slice-by-slice basis. Furthermore, we provide a variability analysis for three physicians for 12 GBMs. The time required for GrowCut segmentation was on an average 61% of the time required for a pure manual segmentation. A comparison of Slicer-based segmentation with manual slice-by-slice segmentation resulted in a Dice Similarity Coefficient of 88.43 ± 5.23% and a Hausdorff Distance of 2.32 ± 5.23 mm.